Historian is a software service for database and cloud data logging. It provides storage into a time-series database for long-term monitoring applications.
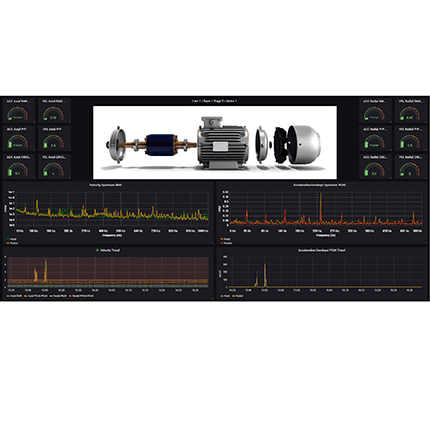
Monitor your vibration, temperature, inclination, strain, pressure, and other data with self-hosted or fully cloud-managed service. Standard OPC UA protocol is supported for data access and integration into our DewesoftX data acquisition software or SCADAs, ERPs, or any other OPC UA clients.
Historian Highlights
- TIME-SERIES DATABASE: Data is stored in a state-of-the-art open-source InfluxDB database. InfluxDB is an open-source time-series database developed by InfluxData. It is written in Go and optimized for fast, high-availability storage and retrieval of time series data in fields such as operations monitoring, application metrics, Internet of Things sensor data, and real-time analytics.
- SELF-HOSTED OR FULLY MANAGED HOSTING: Historian service can either be installed locally on the measurement unit, your local intranet, or we can provide a fully cloud-managed service. For fully hosted managed service monthly fee applies for data storage and maintenance.
- ACCESSIBLE FROM ANYWHERE AND ANYTIME: Data stored in the Historian database can be accessed from anywhere in the world and at any time using an instance of DewesoftX data acquisition software or any standard web browser on any device like computer, tablet, or smartphone.
- VISUALISATION IN GRAFANA: Historian uses another great open-source project called Grafana for visualization of the stored data. Grafana is multi-platform open-source analytics and interactive visualization web application. It provides charts, graphs, and alerts for the web when connected to supported data sources. It is expandable through a plug-in system. End users can create complex monitoring dashboards using interactive query builders.
- DATA SAFETY AND RE-TRANSMIT: In case of network failure or downtime, the measurement units will continue to store the data into the local buffer and will safely transfer the data to the Historian database when the network connection is re-established.
- RAW AND REDUCED DATA: While raw data is always stored on the measurement unit for an in-depth analysis, Historian takes the role of long-term reduced data storage into the cloud database.
- TRENDING AND ANALYTICS: Historical data can always be recalled and loaded from the Historian database and used for trend analysis as well as for in-depth analysis and root cause identification.


 Hoskin Environnement
 Hoskin Géotechnique
 Hoskin Instrumentation

 Posez une question sur ce produit


